


🚨 California Atmospheric River Storms 2023 — Full Breakdown Report
San Mateo County & Peninsula (Winter 2022–2023)
Why This Matters to Homeowners in San Mateo County:
When repeated atmospheric rivers hit, your local drainage system doesn’t fail once—it stays overloaded until water finds its way into your home.
San Mateo Creek Flood (1955): System Overload Event
El Niño Flooding (1998): Countywide Drainage Failure
Pulgas Pipeline Risk: Critical System Vulnerability
Pacifica Sewer Failures (Recurring): Coastal System Breakdown
Drought System Stress (2014–2015): Pressure Instability
Atmospheric River Flooding (2023): System Overload
San Bruno Pipeline Explosion (2010): Underground Failure
Belmont Creek Flooding (Recurring): Drainage Bottlenecks
Hillside Drainage Failures (Recurring): Gravity Overload
Water Main Failures (Recurring): Aging System Breakdown
📍 Geographic + Structural Context (Pre-Event Environment)
This was a multi-storm system overload across San Mateo County, impacting coastal, hillside, and Bayfront communities simultaneously.
Primary regions and cities affected (for scale + search relevance):
- Peninsula corridor: San Mateo, Redwood City, San Carlos
- North County: Burlingame, Millbrae
- South County: Menlo Park, East Palo Alto
- Coastal zones: Pacifica, Half Moon Bay
Critical preconditions:
- Interconnected systems: Creeks, storm drains, culverts, and Bay outflows
- Urbanization: High percentage of impermeable surfaces increasing runoff
- Hillside runoff: Rapid flow from elevated terrain into lowlands
- Aging infrastructure: Systems not designed for repeated extreme events
- Limited recovery time: Systems require time to drain between storms

🌧️ Weather + Environmental Conditions
This event was driven by a series of atmospheric river storms, not a single storm.
- Multiple high-intensity rainfall events over weeks
- Saturated ground conditions across entire county
- Continuous inflow into drainage systems
- Minimal time for water levels to recede
👉 Key dynamic:
The system never reset—each storm stacked on top of the last
⚙️ Failure Mechanics (What Actually Broke)
Step-by-Step Breakdown
- Initial Saturation (System Priming)
- First storms saturated soil and filled drainage systems
- Ground lost absorption capacity
- Repeated Runoff Loading
- Each additional storm added new volume
- No recovery period between events
- System Carryover (Critical Factor)
- Water remained in:
- creeks
- storm drains
- Next storm added on top of existing load
- Capacity Exceeded Across Network
- Multiple systems reached maximum capacity simultaneously
- Bottlenecks formed throughout network
- Overflow + Backflow Activation
- Water overtopped:
- creek channels
- drainage systems
- Backflow occurred in lower areas
- Multi-Zone Flooding
- Flooding spread across:
- residential neighborhoods
- roadways
- commercial areas

💥 The Event (Winter 2022–2023)
- Timeline: Repeated flood events over weeks
- Initial warning signs:
- recurring street flooding
- persistent high water levels
Collapse Dynamics
- System transitioned from:
- functional → saturated → continuously overloaded
👉 Failure wasn’t a moment—it was a sustained condition
🏚️ Immediate Damage Profile
- Widespread localized flooding across county
- Repeated impacts in same neighborhoods
Damage characteristics:
- Interior water intrusion
- Infrastructure strain and failure
- Increased erosion and ground instability
🧠 System-Level Failure Analysis
1. Stacked System Load
- Systems never returned to baseline
👉 overload compounded over time
2. Duration-Based Failure
- Not just intensity
👉 repeated stress caused breakdown
3. Network-Wide Vulnerability
- Interconnected systems failed together
🔁 Direct Aftermath (Short-Term)
- Continuous emergency response over extended period
- Repeated cleanup cycles
- Ongoing monitoring of water levels
🧱 Indirect Effects (Long-Term Changes)
🏗️ 1. Infrastructure Stress Testing
- Recognition of need for:
- higher capacity systems
🌊 2. Flood Mitigation Planning
- Increased focus on:
- stormwater management
📡 3. Early Warning Systems
- Improved monitoring of:
- storm intensity and system load
🏘️ 4. Climate Adaptation Awareness
- Recognition that extreme events are becoming more frequent
🧩 Hidden Insights (What Most People Miss)
⚠️ 1. “The System Didn’t Get a Break”
Recovery time is critical
⚠️ 2. Repetition Is More Dangerous Than One Event
Each storm added stress
⚠️ 3. Flooding Becomes Predictable Under Load
Once saturated
👉 failure is inevitable
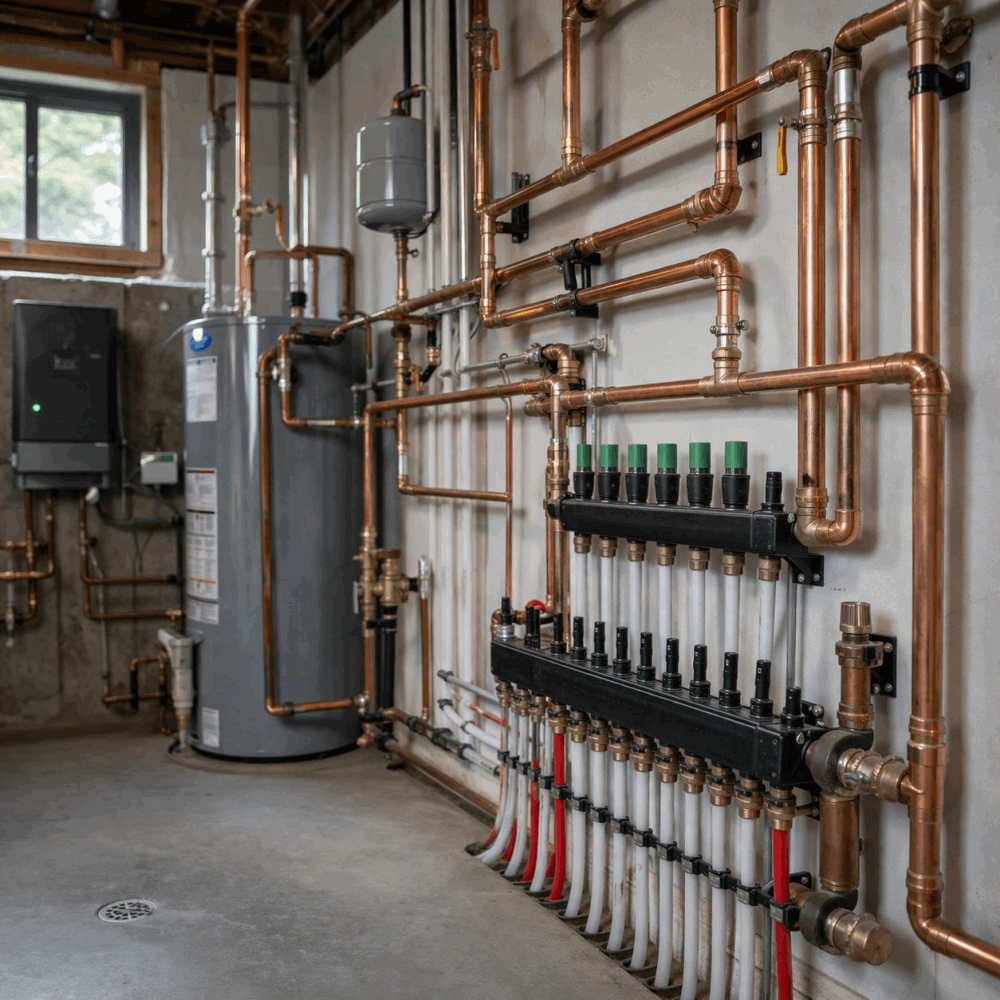
🧠 Contractor / System Thinking Translation
Infrastructure System | Residential Equivalent |
Repeated storms | Repeated system stress |
Carryover load | Existing plumbing issues |
Overflow | Backup/flooding |
Multi-zone impact | Whole-home system failure |
👉 Same equation:
Repeated load + no recovery = total system overload
🏠 What This Means for Your Home
- Repeated stress increases failure risk
- Existing plumbing issues get worse under load
- Drain systems fail when they don’t have time to recover
- Flooding risk increases with each storm, not just the first
🎯 Final Takeaways (Mechanical Framing)
- Root Cause: Repeated atmospheric river storms
- Trigger: Continuous runoff with no system recovery
- Failure Type: Sustained multi-system overload
- Impact Multiplier: interconnected systems + duration
Lesson:
When systems stay full, failure becomes inevitable—not accidental