



🚨 San Francisquito Creek Flood — Full Breakdown Report
📍 Geographic + Structural Context (Pre-Event Environment)
The flooding centered along San Francisquito Creek, which forms part of the boundary between Palo Alto and Menlo Park in northern Santa Clara County.

Critical preconditions:
- Jurisdiction split: Creek managed across multiple cities/counties → fragmented responsibility
- Channel limitations: Sections of creek had inconsistent capacity and outdated flood control design
- Urban proximity: Homes built close to creek with minimal setback buffers
- Storm drainage dependency: Local runoff systems fed directly into the creek
- System assumption: Creek could handle seasonal El Niño storm flows
🌧️ Weather + Environmental Conditions
This was a major El Niño-driven storm event.
- Sustained heavy rainfall across the region
- Multiple storm systems with limited recovery time
- Watershed saturation prior to peak flooding
👉 Key dynamic:
Continuous runoff pushed the creek beyond its structural limits
⚙️ Failure Mechanics (What Actually Broke)
Step-by-Step Breakdown
- Soil Saturation (Initial Phase)
- Early rains fully saturated the ground
- Additional rainfall converted into direct runoff
- Runoff Surge Into Creek System
- Stormwater from surrounding neighborhoods rapidly entered the creek
- Flow rates increased significantly
- Channel Capacity Inconsistency
- Some sections of the creek:
- Narrower
- Less reinforced
- Created bottleneck conditions
- Hydraulic Back-Up Effect
- Water slowed at constrained sections
- Upstream water levels rose further
- Overtopping and Breach Points
- Creek exceeded bank height
- Water spilled into adjacent neighborhoods
- Urban Flood Expansion
- Water followed:
- Streets
- Property grades
- Spread across residential zones rapidly
💥 The Event (1998)
- Timeline: Rapid escalation during peak El Niño storms
- Initial warning signs:
- Rising creek levels
- Minor overflow in low areas
Collapse Dynamics
- Creek overtopped in multiple locations
- Flooding spread across Palo Alto neighborhoods
🏚️ Immediate Damage Profile
- 1,700+ properties damaged
- Residential neighborhoods heavily impacted
Damage characteristics:
- Interior flooding of homes
- Structural and property damage
- Displacement of residents

🧠 System-Level Failure Analysis
1. Bottleneck Failure
- System didn’t fail everywhere equally
It failed where:
- Capacity was lowest
2. Fragmented Infrastructure Management
- Multiple jurisdictions = inconsistent upgrades
👉 Weakest section dictates system performance
3. Backwater Effect
- Constricted flow caused:
- Upstream water buildup
- Increased flood risk beyond initial bottleneck
🔁 Direct Aftermath (Short-Term)
- Emergency response and evacuations
- Damage assessment and cleanup
- Temporary flood control measures implemented
🧱 Indirect Effects (Long-Term Changes)
🏗️ 1. San Francisquito Creek Flood Control Project
- Multi-agency effort to:
- Widen and reinforce channel
- Improve flow capacity
🌊 2. Interagency Coordination Improvements
- Better collaboration between:
- Cities
- Counties
- For shared water systems
📡 3. Monitoring + Forecasting Enhancements
- Improved flood prediction and response systems
🏘️ 4. Development Restrictions
- Increased awareness of:
- Building near constrained waterways
🧩 Hidden Insights (What Most People Miss)
⚠️ 1. “The Weakest Section Controls Everything”
A system is only as strong as:
- Its narrowest point
⚠️ 2. Water Backs Up Before It Breaks Out
Flooding isn’t always direct overflow.
- It’s often:
- Backlog pressure
- Then release
⚠️ 3. Boundaries Don’t Matter to Water
City lines are irrelevant.
- Water flows based on:
- Physics, not jurisdiction
🧠 Contractor / System Thinking Translation
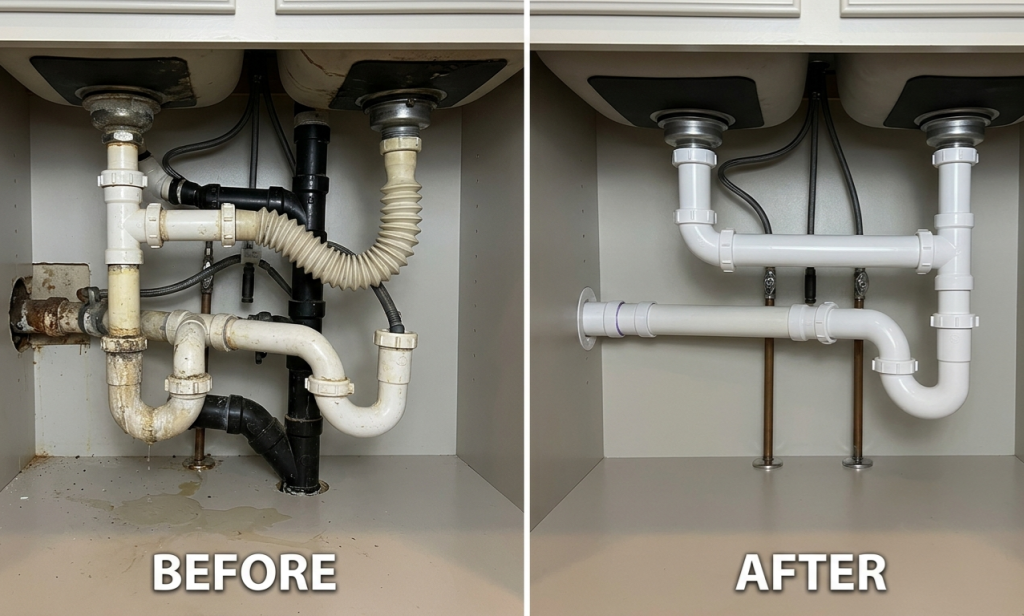
This event maps directly to residential system failures:
Infrastructure System | Residential Equivalent |
Creek channel | Drain line |
Bottleneck section | Partial blockage |
Backwater buildup | Pressure backup |
Overflow | Drain or fixture overflow |
👉 Same equation:
Restriction + flow + pressure = overflow at the weakest point
🎯 Final Takeaways (Mechanical Framing)
- Root Cause: Channel capacity inconsistency + bottleneck constraints
- Trigger: El Niño storm runoff overwhelming system
- Failure Type: Backwater buildup → overflow into neighborhoods
- Impact Multiplier: Fragmented infrastructure + urban proximity
Lesson:
Water doesn’t respect city lines—it follows flow, not boundaries